The Colombo Stock Exchange (CSE) computes 20 sector indices on an ongoing basis and the closing values are published at the end of every trading day. They reflect the price movements of companies in the 20 service sectors. The sector price indices therefore, are an indication of market trends.
Moreover, the S&P/CSE Industry Group Indices are the result of a partnership between S&P Dow Jones Indices and the CSE. They’re designed to measure the performance of various industry groups in the equities market in Sri Lanka as defined by the Global Industry Classification Standard.
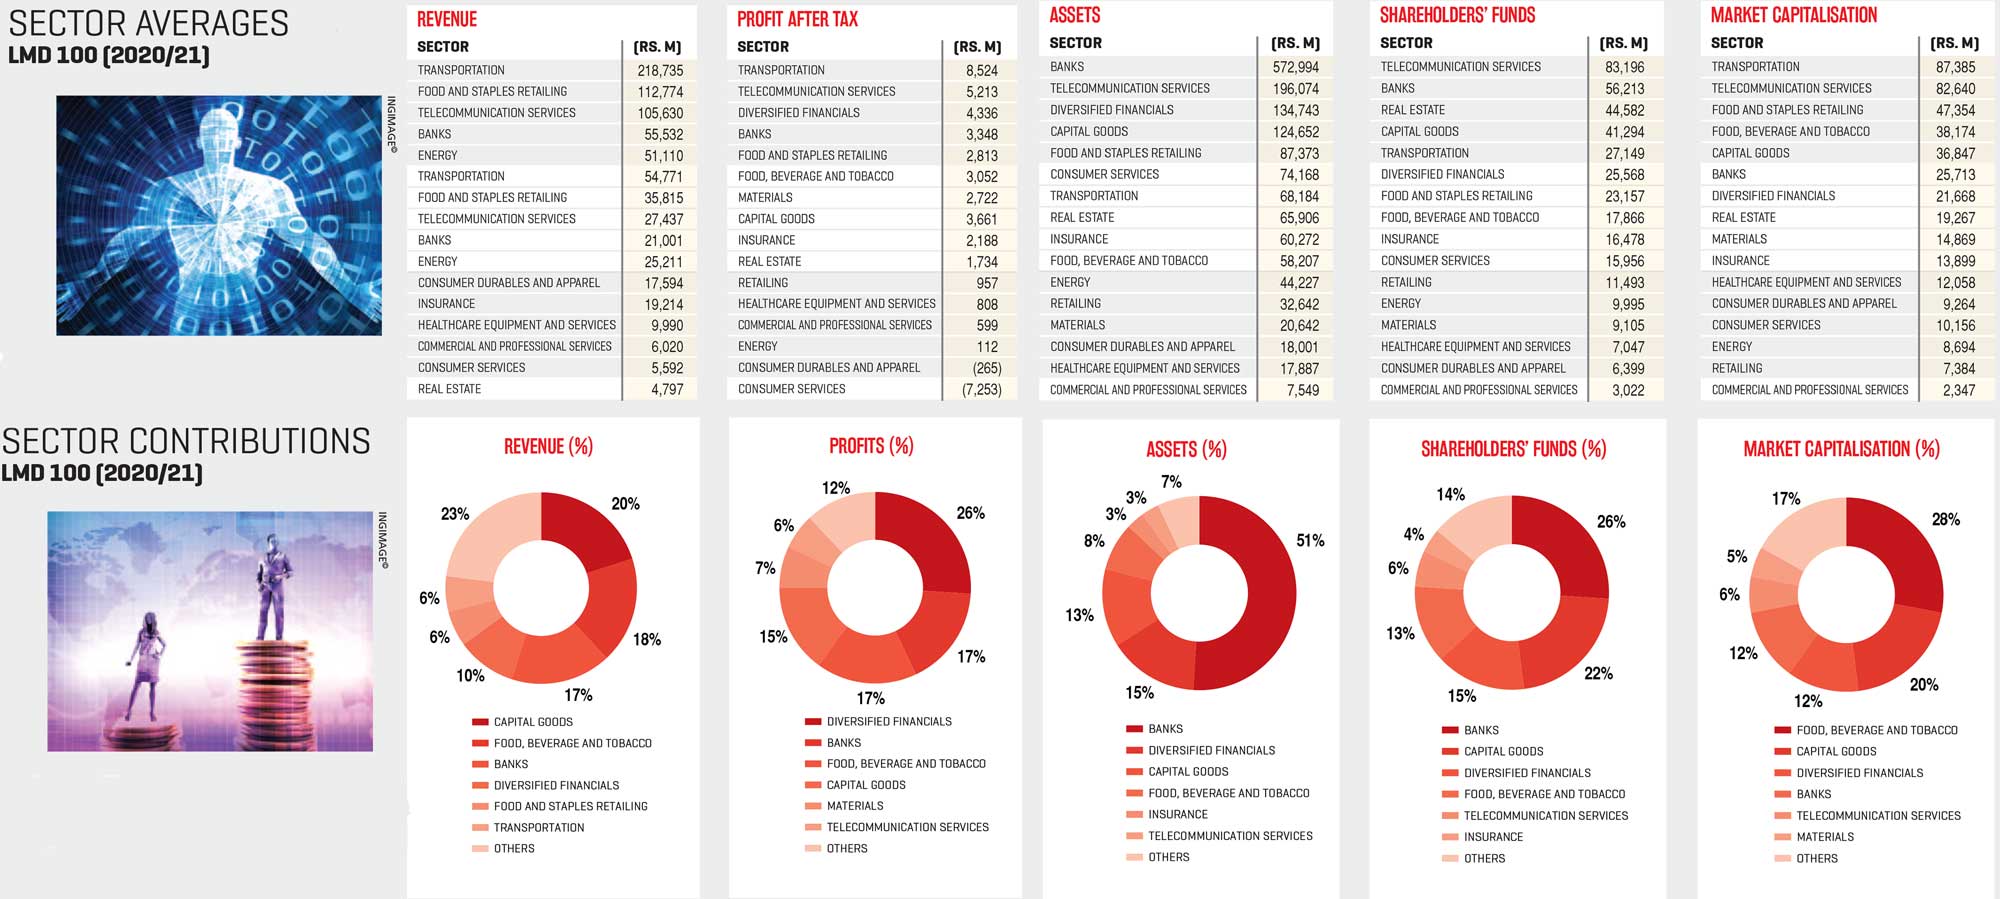
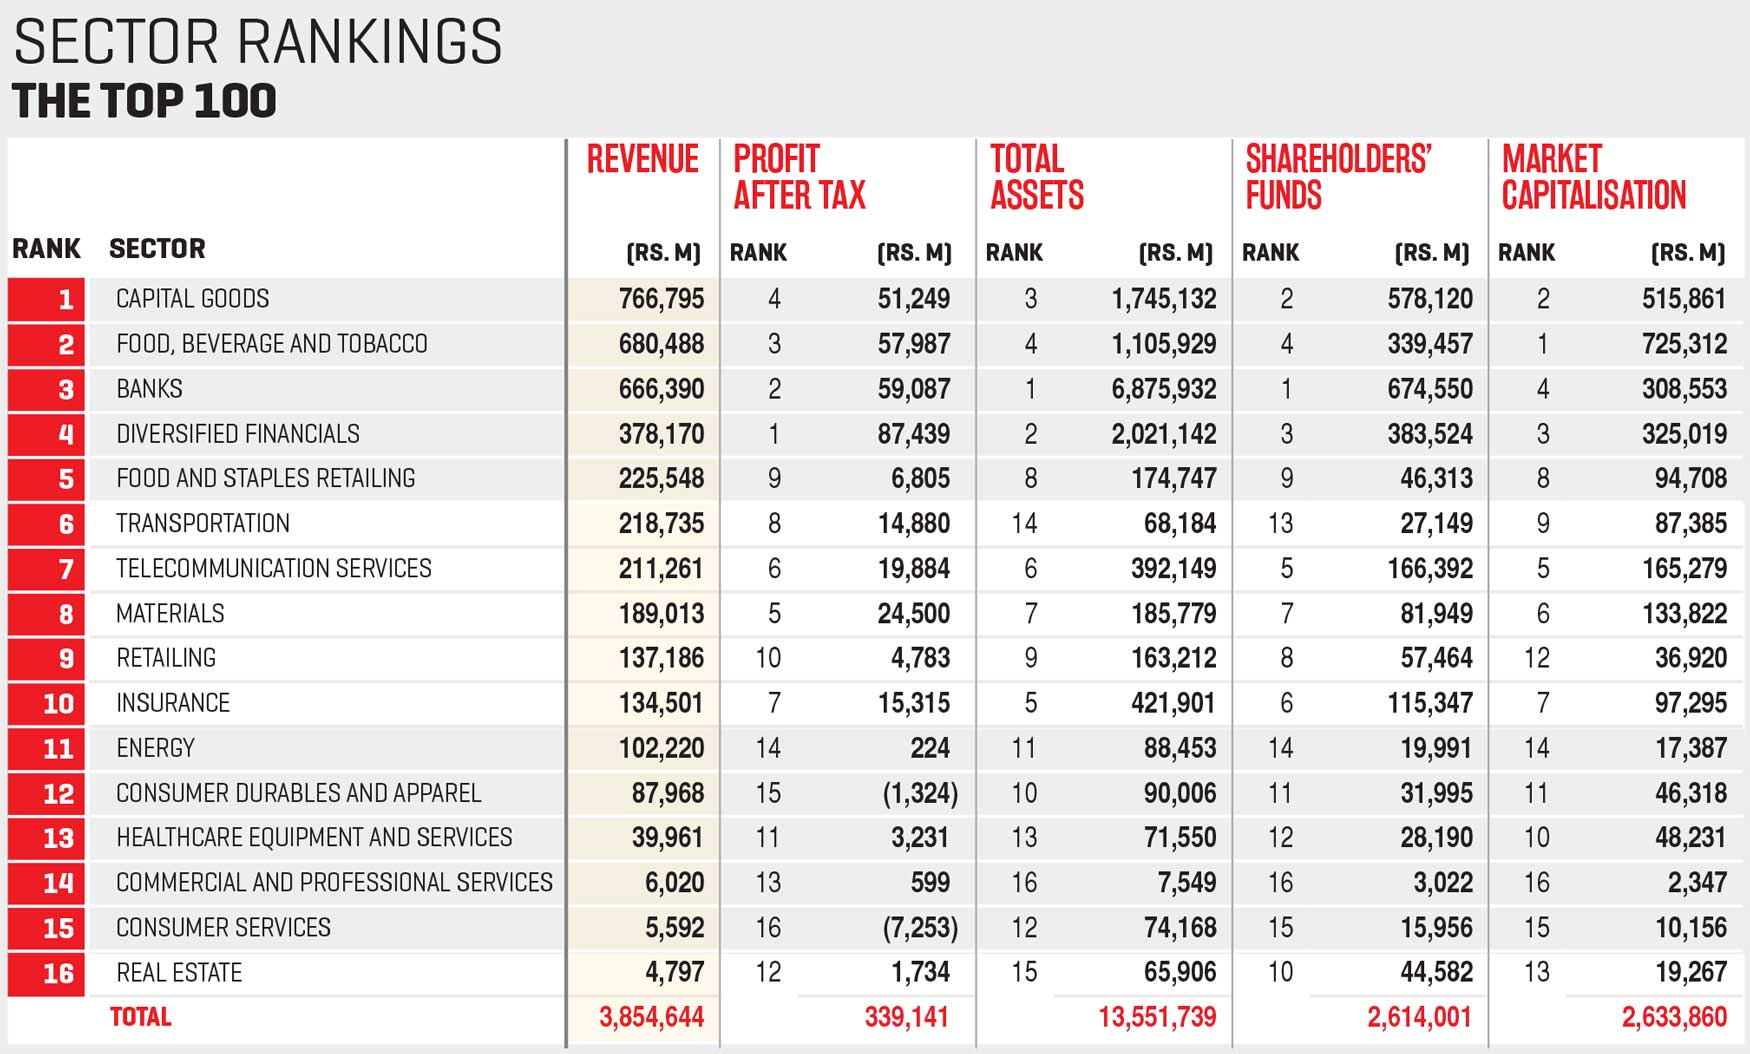
For the purpose of analysing the LMD 100 results, 16 major economic sectors are considered to cover the length and breadth of quoted companies in Sri Lanka – viz. banks; capital goods; commercial and professional services; consumer durables and apparel; consumer services; diversified financials; energy; food and staples retailing; food, beverage and tobacco; healthcare equipment and services; insurance; materials; real estate; retailing; telecommunication services and transportation.
Capital goods lead the way amongst the leading listed companies in Sri Lanka in 2020/21 with their cumulative income representing 20 percent of the LMD 100’s combined revenue and 22 percent of shareholders’ funds.
Food, beverage and tobacco follow as the second largest player in the LMD 100 with an aggregate income in excess of Rs. 680 billion and a share of 19 percent of cumulative revenue in the review period.
What’s more, the sector accounted for 17 percent of LMD 100 profits and 13 percent of shareholders’ funds in 2020/21, and also reigns supreme in terms of its share of the top 100 listed companies’ market capitalisation in this country.

The banks are third in line with their cumulative top line of 666 billion rupees accounting for 17 percent of the LMD 100’s aggregate income. Moreover, the sector represents over half of the LMD 100’s total assets.
Diversified financials – which is the runner-up in the asset stakes – along with food and staples retailing, transportation, telecommunication services, materials, retailing and insurance round off the top 10 sectors in the LMD 100.
SECTOR ANALYSIS This analysis usually involves an evaluation of the condition and potential of sectors in an economy, and provides investors with information with which to make educated judgements in regard to how companies in a given sector are likely to perform.
Investopedia also explains that “sector analysis is typically employed by investors who specialise in a particular sector or use a top-down or sector rotation approach to invest- ing.”
It continues: “In the top-down approach, the most promising sectors are identified first and then the investor reviews stocks within that sector to determine which ones will ultimately be purchased. A sector rotation strategy may be employed by investing in particular stocks or by employing sector-based exchange traded funds.”
“Early in the business cycle, during the expansion phase for example, interest rates are low and growth is beginning to pick up,” it notes, adding that during this stage, investors or analysts who undertake a sector analysis “would focus their research on companies that benefit from low interest rates and increased borrowing.”
It continues: “These companies often perform well during periods of economic growth. These include companies in the financial and consumer discretionary sectors,” it adds. Investopedia also points out that “late in an economic cycle, the economy contracts and growth slows. Investors and analysts will turn their attention to researching defensive sectors, such as utilities and telecommunication services. These sectors often outperform during economic downturns.”
‘Sectors’ are typically considered to be a broad classification. Within each sector, numerous sub-sectors and industries can be further delineated. When it comes to sector rotation strategies, investors may refer to sectors in a number of ways.
The Global Industry Classification Standard (GICS), which has been developed by MSCI and Standard & Poor’s (S&P), is a commonly used taxonomy. It is the result of numerous discussions with asset owners, portfolio managers and investment analysts around the world, and was designed in response to the global financial community’s need for accurate, complete and standard industry definitions.
Its hierarchy begins with 11 sectors (energy, materials, industrials, consumer discretionary, consumer staples, healthcare, financials, IT, communication services, utilities and real estate), and is also represented by 24 industry groups, 68 industries and 157 sub-industries.
For instance, the consumer staples sector consists of three industry groups: food and staples retailing; food, beverage, and tobacco; and household and personal products.
These industry groups are further broken down into industries. Sector rotators may not be limited to sectors and could choose to emphasise industry groups, industries or sub-industries.